Speedrun splitsYear by year, ahead or behind?
FAS was ahead of 3× pace in 1 of 7 years
PreviewSquare · 720 × 720 · Dark
3× pace = 3 times XLF that year. 2026 is the year so far
Other ways to see it
More in Beat the market Did it beat the Nasdaq?KindWould a plain Nasdaq fund have done better?
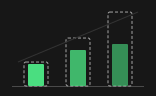 Leverage ladderKindDid each fund deliver its multiple?
 Promise vs deliveredKindDo I still get 3× after one day?
 100 one-year holdsKindHow often did a year’s hold work?
 Range of past outcomesKindWhat range did holders get?
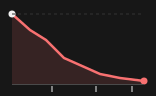 Bear fund since launchKindWhat happened to $10,000 in a bear fund?
Also in Who's winning?
All 24 pictures →Return 9All 9 in Return →
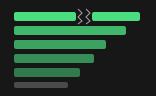 Ranked barsLead pictureWho is up the most?
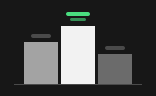 PodiumWho is on the podium?
 Tier listWhich big funds are top tier?
 Theme leader stripDoes one theme stay on top?
 Base camp to summitWhich themes are at their highs?
 CometsAre new funds beating the market?
 Growth raceWhere would $10,000 be now?
 Tale of the tapeWhich of two funds wins?
 Fund trading cardOne fund’s vital stats
Payouts 8All 8 in Payouts →
 Yield leaderboardWho pays the most right now?
 Income snowballWho pays more every year?
 Payout pulseIs the cash holding up?
 Payouts vs price lostAre payouts ahead of the price lost?
 The scaleDid payouts make up for the loss?
 House-money meterHave payouts paid me back yet?
 Payout historyIs the payout steady?
 Dividend staircaseHas the payout grown every year?
Same picture, three shapes
Square and Tall for social feeds, Wide for posts and slides.
74 pictures in all · Back to Visualizations