A year as a rideHow bumpy was this year?
climbed 163% and still finished down 21%
PreviewSquare · 720 × 720 · Dark
Climbed: up days added up. Descended: down days
Other ways to see it
More in Ups and downs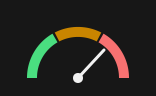 Risk dialFundHow risky is this fund?
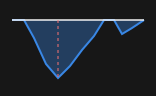 Underwater chartFundHow deep were the falls?
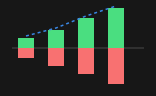 Climbing backKindWhat does it take to get back to even?
 Distance to zeroKindHow near has a 2× fund come to zero?
 Health barKindHow much of the price has worn away?
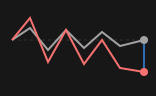 The flat-index trapKindHow can a fund lose when its index is flat?
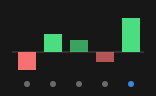 Which day paysKindDo some weekdays do better?
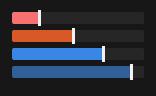 Days since last reverse splitKindHow often do bear funds merge shares?
Also in How broad is it?
All 17 pictures →Up vs down 4All 4 in Up vs down →

Spread 4All 4 in Spread →

Same picture, three shapes
Square and Tall for social feeds, Wide for posts and slides.
74 pictures in all · Back to Visualizations